PinnedJoséphine PicotScrape an online newspaper and display the hot topics in a Word Cloud -PythonI. Scraping4 min read·Dec 25, 2021----
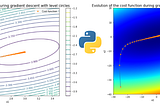
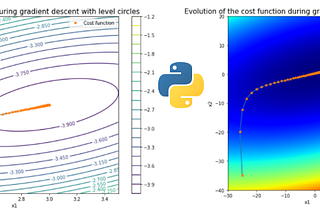
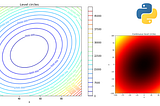
PinnedJoséphine PicotinAnalytics VidhyaVisualize the gradient descent of a cost function with its level circles -PythonHi! Here we will compute the gradient of an arbitrary cost function and display its evolution during gradient descent. All the code is…3 min read·Feb 11, 2021--1--1
Joséphine PicotPourquoi la France devrait-elle accélérer sa recherche en génétique?Si la modification génétique peut potentiellement poser un problème éthique, on sait que la Chine et d’autres pays ont déjà mis la main à…2 min read·Dec 11, 2022----
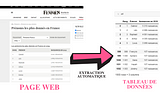
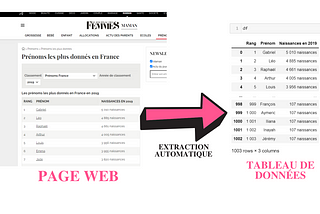
Joséphine PicotScraping avec Python -Tuto- Partie 1 : pages web statiquesI. Quelques définitions :7 min read·Jun 19, 2021----
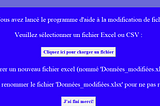
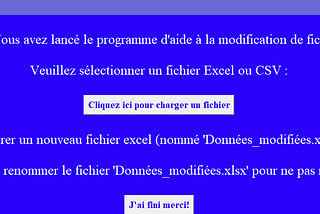
Joséphine PicotCoder une application en Python avec tkinter (interface graphique simple) qui s’exporte facilement…L’application que nous allons coder va :7 min read·Mar 29, 2021--1--1
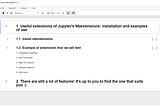
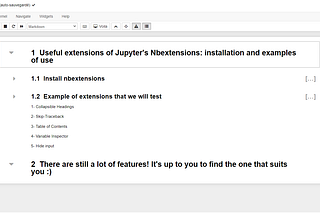
Joséphine PicotUseful extensions of Jupyter with Nbextension: installation and examples of useTo run the jupyter you can just download the Github repository.4 min read·Jan 29, 2021----
Joséphine PicotLes raccourcis clavier sur Jupyter Notebook!Quand on fait de la Science des Données (Data Science) on peut être amené à réaliser un Notebook (un programme comprenant du code et du…2 min read·Dec 21, 2020----
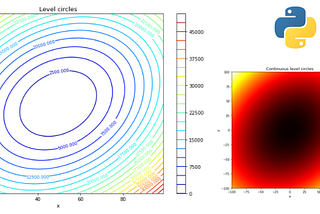
Joséphine PicotinAnalytics VidhyaVisualization of the level circles of a real function of two variables (ℝ² in ℝ) with python…In this article I show you how to plot a function of ℝ² in ℝ from the point of view of its level circles. Here are some examples of…4 min read·Nov 18, 2020----
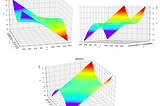
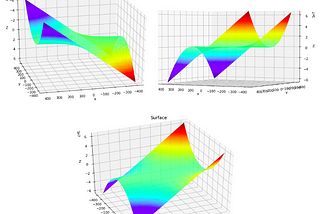
Joséphine PicotinAnalytics Vidhya3D visualization of a function of two variables (from ℝ² into ℝ) with Python -MatplotlibIn this tutorial we will see how to display a function from ℝ² into ℝ in 3 dimensions and interactively with python.5 min read·Nov 17, 2020----
Joséphine PicotReprésenter les cercles de niveau d’une fonction de R² dans R avec pythonDans cet article je vous montre comment représenter une fonction de R² dans R du point de vue de ses cercles de niveau. Voici un exemple…4 min read·Nov 16, 2020----